
Continental Resources is taking the guesswork out of completions planning using advanced shale play optimization analytics and reporting capabilities developed by Stonebridge Consulting.
Client
Based in Oklahoma City, Continental Resources is the largest leaseholder and one of the largest producers in the nation’s premier oil field, the Bakken play of North Dakota and Montana. The company also has significant positions in Oklahoma, including its SCOOP Woodford and SCOOP Springer discoveries and the Northwest Cana play. With a focus on the exploration and production of oil, Continental has unlocked the technology and resources vital to American energy independence. In 2015, the company celebrates 48 years of operations.
Challenge
Faced with a dynamic market and its impact on future horizontal drilling opportunities, operators like Continental are asking themselves, “How can we maximize our potential earnings in each play?” Because the North American shale revolution has unlocked vast amounts of reserves once thought impossible to exploit, operators are scrutinizing completions data by play like never before to better understand key operational questions:
- Are we maximizing our earnings potential compared to estimated reserves?
- What are the contributing factors that impact production optimization?
- Which completion method is creating the most value?
To get answers to these questions, Continental engaged Stonebridge Consulting to provide business advisory and technology enablement services required to develop advanced shale play optimization analytics and reporting capabilities.
Solution
Stonebridge worked with a cross-functional project team comprising Continental executive management, IT, and key personnel in resource development, completions, production to gather business-side requirements for play optimization analytics and reporting. Additionally, Stonebridge and Continental’s IT leadership formed a blended team to develop the technical road map and deliver an innovative solution involving integration of play-specific data and advanced reporting and data visualization.
Play-Specific Data – To unlock the reporting potential of play-specific data, the project team focused on how production is affected by completions methods and how that compares to what the company was expecting to produce. Getting this business perspective required a combination of completions, well header, reservoir, and production data.
- Completions – WellView® was leveraged to pull key completions data such as fluid type, proppant type, and volume.
- Well Header – Core data attributes were company-wide well identifier, well name, location, and working interest.
- Production – Sources included Continental’s internal production system complemented by public information sources based on 30-, 60-, and 90-day averages.
- Reservoir – The focus was on actual performance against unplanned reserves as well as account reserves data such as EUR, BOE, gas, oil, and water.
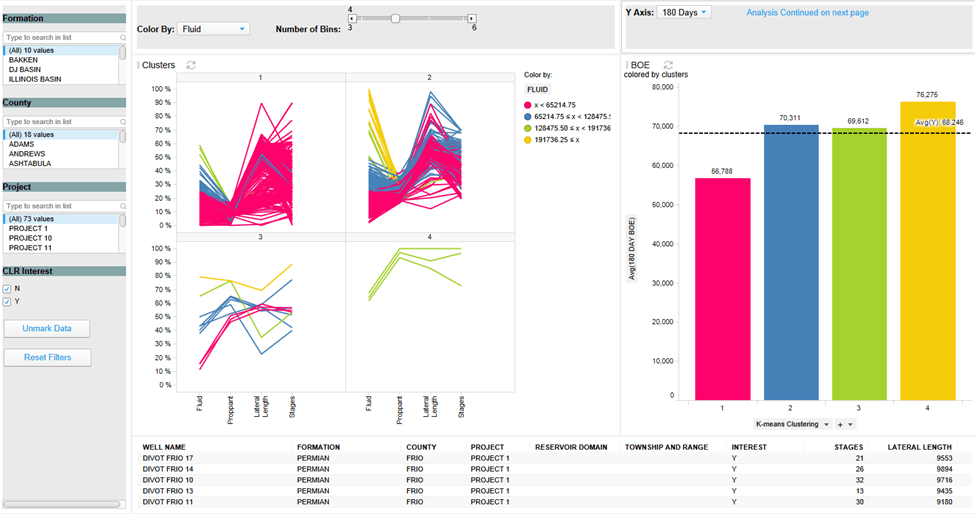
Reporting – TIBCO Spotfire business intelligence software is used to visualize play-specific data for gaining insight into productivity of each play. In Figure 1, Continental business users can pull wells in a particular formation and compare completions method to production in order to see how the various factors (e.g., fluid type and proppant) relate to production.
Figure 1: Production to Completions
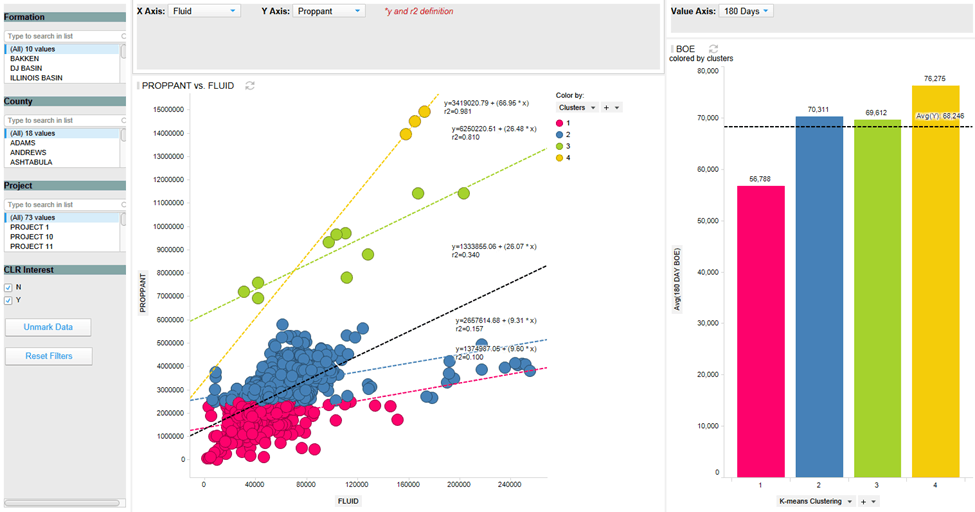
Additionally, the play optimization reporting solution enables Continental to see how different factors can influence production levels (Figure 2).
Figure 2: Influence of Fluids and Proppants
Food for Thought: Completions Data Best Practices
Data Entry: Now that completions data is being used to drive production performance, companies should take a closer look at how they are entering completions data in WellView®. Is your company utilizing the most up-to-date capabilities in WellView® 10 around capturing completions data by interval? Are there consistent processes and procedures in place to ensure accurate information? Is your historical data clean and available?
Integration: To make completions data meaningful, companies need to look at how production is affected by completions methods and how it compares to what the company was expecting to produce. In order to do that, completions, well header, public, reservoir and production data need to be integrated together in a data management tool.
Reporting: Once the data is integrated, companies can then detect patterns that can be used to make smarter business decisions and develop key performance indicators to monitor the process. Once those indicators are in place, utilizing a reporting tool like Spotfire will allow companies to build forecasts on historical trends as well as take action on suspicious metrics.
Next Step
Interested in a similar solution for your organization? Click here to start a dialogue with Stonebridge.