NOTE: Stonebridge Consulting helps oil and gas companies use Spotfire to improve their operational analysis. Contact us today to learn more about how we can help you.
Recently I was tasked with a Spotfire development project to create a table that would compare yesterday’s production versus forecast as well as compare yesterday’s production versus the previous day (day before yesterday/two days ago).
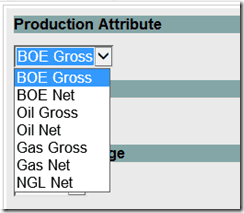
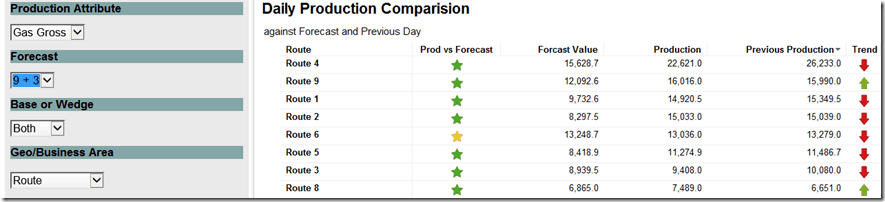
I allow the user to pick one production measurement to compare against using a drop down list property control.
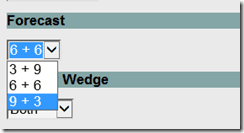
They are also allowed to pick a specific forecast for comparison.
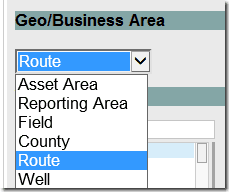
The last dropdown selects the well level hierarchy we want to view. “Well” is the lowest (base) level all the way up to highest level in the hierarchy “Asset Area”.
Production versus Forecast
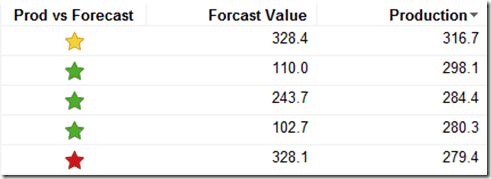
Our first objective is to add an icon axis to determine how yesterday production compared to yesterday’s forecast.
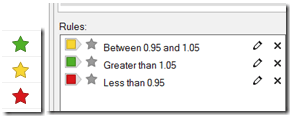
I used a star with a traditional stoplight color scheme (green –above forecast 105% or greater, yellow – close to forecast 95%-105%, red – below forecast 95% or less).
To just get yesterday’s value I will do a calculated ‘dashboard ranking’ column.
Rank([Production Date],”desc”,[Well Name],[Forecast]),null)
Since my most recent value is yesterday I limit my data to pick just yesterday’s production. Do this in the axis and check ‘specify separate data limiting’.
Data Limiting
[DashboardRanking] = 1 AND ([Forecast] = (${Forecast}) or [Forecast] = ‘Production’)
Now we will enter the calculated Icon Expression.
Expression
case
when “${ProductionAttribute}” = “BOE Gross” then Sum([BOE Gross Production])/Sum([BOE Gross Forecast])
when “${ProductionAttribute}” = “BOE Net” then Sum([Net BOE Production])/Sum([Net BOE Forecast])
when “${ProductionAttribute}” = “Oil Gross” then Sum([Oil Gross Production])/Sum([Oil Gross Forecast])
when “${ProductionAttribute}” = “Oil Net” then Sum([Net Oil Production])/Sum([Net Oil Forecast])
when “${ProductionAttribute}” = “Gas Gross” then Sum([Gas Gross Production])/Sum([Gas Gross Forecast])
when “${ProductionAttribute}” = “Gas Net” then Sum([Net Gas Production])/Sum([Net Gas Forecast])
when “${ProductionAttribute}” = “NGL Net” then Sum([Net NGL Production])/Sum([Net NGL Forecast])
end
To check our calculations we will add a calculated value axis for forecast and production. Use the same data limiting values.
Forecast
Data Limiting
[DashboardRanking] = 1 AND [Forecast] = ${Forecast}
Expression
case
when “${ProductionAttribute}” = “BOE Gross” then Sum([BOE Gross Forecast])
when “${ProductionAttribute}” = “BOE Net” then Sum([Net BOE Forecast])
when “${ProductionAttribute}” = “Oil Gross” then Sum([Oil Gross Forecast])
when “${ProductionAttribute}” = “Oil Net” then Sum([Net Oil Forecast])
when “${ProductionAttribute}” = “Gas Gross” then Sum([Gas Gross Forecast])
when “${ProductionAttribute}” = “Gas Net” then Sum([Net Gas Forecast])
when “${ProductionAttribute}” = “NGL Net” then Sum([Net NGL Forecast])
end
Production
Data Limiting
[Forecast] = ‘Production’
AND
[Production Date] < Date(DateTimeNow())
and
[Production Date] >= DateAdd(‘dd’,((${LastDays}+1) * -1),DateTimeNow())
Expression
case
when “${ProductionAttribute}” = “BOE Gross” then Sum([BOE Gross])
when “${ProductionAttribute}” = “BOE Net” then Sum([Net BOE])
when “${ProductionAttribute}” = “Oil Gross” then Sum([Oil Gross])
when “${ProductionAttribute}” = “Oil Net” then Sum([Net Oil])
when “${ProductionAttribute}” = “Gas Gross” then Sum([Gas Gross])
when “${ProductionAttribute}” = “Gas Net” then Sum([Net Gas])
when “${ProductionAttribute}” = “NGL Net” then Sum([Net NGL])
end
We can now check to see that we got the correct icon results
Production Trend
Now we would like to compare yesterday versus the previous day.
To do this we will create an icon graph and limit the data to the prior two days.
Data Limiting
[DashboardRanking] in (1,2) AND [Forecast] = ‘Production’
We will now calculate icons by taking yesterday minus the previous day.
Expression
case
when “${ProductionAttribute}” = “BOE Gross” then
sum((If([DashboardRanking]=1,[BOE Gross],0)) – (If([DashboardRanking]=2,[BOE Gross],0)))
when “${ProductionAttribute}” = “BOE Net” then
sum((If([DashboardRanking]=1,[Net BOE],0)) – (If([DashboardRanking]=2,[Net BOE],0)))
when “${ProductionAttribute}” = “Oil Gross” then
sum((If([DashboardRanking]=1,[Oil Gross],0)) – (If([DashboardRanking]=2,[Oil Gross],0)))
when “${ProductionAttribute}” = “Oil Net” then
sum((If([DashboardRanking]=1,[Net Oil],0)) – (If([DashboardRanking]=2,[Net Oil],0)))
when “${ProductionAttribute}” = “Gas Gross” then
sum((If([DashboardRanking]=1,[Gas Gross],0)) – (If([DashboardRanking]=2,[Gas Gross],0)))
when “${ProductionAttribute}” = “Gas Net” then
sum((If([DashboardRanking]=1,[Net Gas],0)) – (If([DashboardRanking]=2,[Net Gas],0)))
when “${ProductionAttribute}” = “Net NGL” then
sum((If([DashboardRanking]=1,[Net NGL],0)) – (If([DashboardRanking]=2,[Net NGL],0)))
end
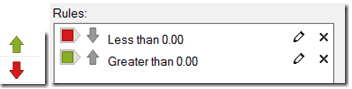
A positive result means that the trend is up, if it is negative trend is negative. We will be using green upper arrows for a positive trend and a red downward arrow to show a downward trend.
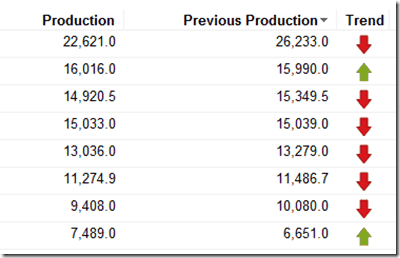
To test this we will create a calculated column axis that just shows the previous days production.
Data Limiting
[Forecast] = ‘Production’
AND
[Production Date] < Date(DateTimeNow())
and
[Production Date] >= DateAdd(‘dd’,-2,Date(DateTimeNow()))
and [Production Date] < DateAdd(‘dd’,-1,Date(DateTimeNow()))
Expression
case
when “${ProductionAttribute}” = “BOE Gross” then Sum([BOE Gross])
when “${ProductionAttribute}” = “BOE Net” then Sum([Net BOE])
when “${ProductionAttribute}” = “Oil Gross” then Sum([Oil Gross])
when “${ProductionAttribute}” = “Oil Net” then Sum([Net Oil])
when “${ProductionAttribute}” = “Gas Gross” then Sum([Gas Gross])
when “${ProductionAttribute}” = “Gas Net” then Sum([Net Gas])
when “${ProductionAttribute}” = “NGL Net” then Sum([Net NGL])
end
We can now check to see that we got the correct icon results.
Full Results
LAST WORD: Have a specific Spotfire development need? CLICK HERE to request a call from one of our Spotfire experts!